The team discussed using custom reports to determine which device models to target for a refresh. They suggested exporting data to power Bi or creating a script to gather information, and mentioned the new Edge DX api. They also noted potential limitations with aggregation on the tenant side. A member asked for clarification on connecting multiple indexes in Power Bi. The conversation concluded with instructions for paging through data or using export.
Read the entire ‘Improving Device Refresh Strategies through Custom Reports and Power BI Integration’ thread below:
Hello team! I have a question around custom reports. I want to put together a report that would help us determine which device models we should target in our environment for a refresh. I am would like to list out the averages of things like battery health, blue screen events, and DEX score etc per model.
Funny, I was brainstorming the same thing so I’m interested to hear what others may have implemented already.
As far as I know,
You can’t connect data index together to create a custom report (yet)
You can export the data via api to power Bi and then create yourself a nice report and dashboard
But if you have some time please go check the user voice site , myself and a few other people have asked that this becomes a function to connect data index , please go and up vote it
You could also create a script that will give you all the info and then write that into data index and then you have your custom report
Hope my reply helps
I am attempting to use powerbi now however I cannot find any recent documentation on how to connect to the new Edge DX api with powerbi
https://apidoc.sip.controlup.com/
Does this help?
Do note that when you create a blank query and start using web data, PowerBI will prompt you how you want to authenticate.
You have to select anonymous. As the authentication is already present in the PowerBI query/script.
This is also shown at the last portion of the video
Pretty much every index will have a device name and device ID that you can use to cross reference multiple indexes
Last but not least. For something like this, depending on how many devices your tenant has, you might need to do this aggregation on the tenant side.
> I am would like to list out the averages of things like battery health, blue screen events, and DEX score etc per model.
As the output is limited to 65k records.
If you want aggregate on the tenant side, let me know. It’ll be a bit more complex as you’d have to send ElasticSearch queries with the query.
Thanks Dennis. That does help a lot as I ran into the same issues as Jose, so I appreciate this info.
Sorry, i don’t intend on hijacking Jose’s thread but in Power BI, if we want to connect to multiple indexes, just create another blank query in Power Query and change the URL? Or is there a more efficient way?
I am very novice in PowerBI. But yes, multiple blank queries
This is excellent Dennis! Thank you. I will give it a try now.
@member I was able to pull in some data but I may need to aggregate on the client side as you mentioned. We have about 16000 devices at I am only seeing about half come down
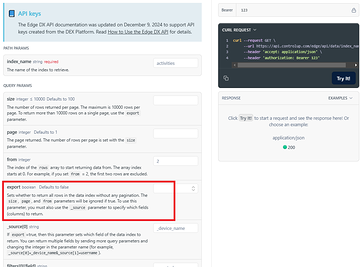
yeah its 10k per page. I think you can set the page size. Hold on
You might need to either:
• page through the data. I have an example of a different API whose format is a bit different that I page through in PowerBI. If you want to go that route.
• Use export but then you have to specify which columns you want.
Continue reading and comment on the thread ‘Improving Device Refresh Strategies through Custom Reports and Power BI Integration’. Not a member? Join Here!
Categories: All Archives, ControlUp for Desktops, ControlUp Scripts & Triggers