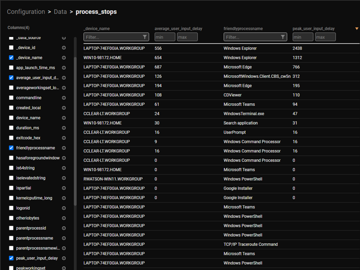
A user wanted to understand the cause of an input delay (measured at 60s), but the CPU said 21%, hover-over didn’t show anything, and active processes revealed nothing more than 0%. The suggestion was to look at the process_stops index, but there is no way to add this into an alert for easy identification.
Read the entire ‘Investigating Input Delay Causes’ thread below:
Peak User Input Delay – I am trying to understand what is causing the input delay. I see the input delay is 60s, I can see the CPU says 21% but doesn’t show anything when hovering over the datapoint, active processes says nothing is at more than 0%. Is there a way to see what the instance or process that is causing the delay?
Take a look at the process_stops index

Okay. Is there a way to get this added into the alert somehow to more easily identify the issue without having to go through the databases like this?
No. Not currently.
Continue reading and comment on the thread ‘Investigating Input Delay Causes using ControlUp’. Not a member? Join Here!
Categories: All Archives, ControlUp for Desktops, ControlUp Scripts & Triggers
