This discussion provided tips on troubleshooting Protocol latency issues, with a focus on VMware. Suggestions included eliminating different factors such as resource contention, latency on server/datacenter-side, and client-side bandwidth issues. An example was given of a session with very poor user experience (caused by a data center issue), illustrating how this type of issue can be identified by looking at other sessions’ bandwidth limit.
Read the entire ‘Troubleshooting Protocol Latency Issues in VMware Environments’ thread below:
Hi guys, any tips on troubleshooting Protocol latency issues?
Let me find my copy/paste. Note that this is focused on VMware. But the same concepts should apply to Citrix.
Also having RemoteDX data is useful in this context.
> Typically in these situation we use ControlUp data in a process of elimination to eliminate different factors.
>
> 1. Was there a resource contention issue at the time?
> Look at machine and/or host cpu/memory utilization. Insights/Solve (session activity > that particular session) can show you for both the user session and the computer it was on (in case it was a session shared machine) the resource usage. This is unlikely to be your problem.
>
> 2. Was there a latency issue at the client side?
> Same session activity details report above shows latency data for the session. Granted, this is gathered on the VM side of things. So if the connection was severed, you don’t get latency data. But you might see a spike just before disconnect.
> This is where remote DX data would be very helpful. As it would also show things like wifi signal strength, local gateway latency, internet as a whole latency, etc.
> Useful though not required.
>
> 3. Was there a latency issue on the server/datacenter side?
> Was there high latency for other users on that same machine, host or even data center? If so, perhaps this was an issue on the host/datacenter side?
>
> 4. Was there a bandwidth issue on the client side?
> Look at bandwidth limit. Was it low? Bandwidth limit is determined by the protocol (Blast, PCOIP or I guess RDP?) and it won’t be very precise. But it will tell you if the user had plenty of bandwidth with numbers in the double or even triple digits. Or if the user had terrible bandwidth with numbers in the low single digits.
>
> This can be caused by things like other things consuming bandwidth in the users home network.
>
> Imagine someone watching netflix. Netflix might consume a large portion of a relatively low bandwidth DSL connection. Leaving not enough bandwidth for the Horizon connection. Leading to latency and/or disconnects.
>
> 5. Was there a bandwidth issue on the machine/host/datacenter level?
> Again, unlikely to be your issue. But perhaps the machine, host or data center had bandwidth issues? To determine this, look at other sessions bandwidth limits on the same machine, host or data center
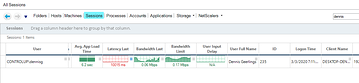
I’ll give you an example of a session of mine a while ago. I had very poor user experience. Why? Because my available bandwidth was very low. So low that it took a lot of time to send screen updates over the limited connection.
Note how my (protocol) latency is 10015 (10 seconds!) and bandwidth limit is not even single digits but 0.17
This could be because my internet connection was utilized to it’s breaking point. Or some other issue on the path between my machine and the data center (ISP related?)
In this case by the way, it turned out to be a data center issue. This was a connection to a data center in Europe. At the time, ControlUp internal IT was performing offsite backups. Consuming almost all available bandwidth, leaving none my session.
You could see this by looking at other sessions bandwidth limit. I don’t have a screenshot. But all sessions had low bandwidth limits.
This is an unlikely scenario. But illustrates the concept
Thansk, this helps alot
Continue reading and comment on the thread ‘Looking for tips on troubleshooting Protocol latency issues?’. Not a member? Join Here!
Categories: All Archives, ControlUp for VDI