A user asked if it is possible to get granular data from ControlUp to troubleshoot an issue with calls dropping on a telephony system. It was suggested that an alert or script be set up to gather data, however the customer preferred to use Citrix ADM. ControlUp already gives extra details for the Protocol Latency metric such as Min, Max and Avg over a 5-minute interval and users were asked if this was helpful for the issue. The question was left open-ended to determine if more granular data could be made available in the future.
Read the entire ‘Troubleshooting a Telephony Issue With ControlUp Data’ thread below:
I am going to raise a request around this but want to post and get some thoughts on it
I got feedback on RemoteDX for two customers. The issue that they are is with Genesys https://www.genesys.com/solutions/enterprise-call-center
Users have issues where their calls with the software randomly Drop for Remote and internal users when using wyse laptops. We deployed RemoteDX to the device
But we could not see any issues, They also have Citrix ADM with HDX Insights
With HDX insights they could see the latency for the user session with 1 min intervals this showed them large spikes in the latency that were causing the
issue with the call center calls
But with RemoteDX the data is averaged over 5 mins in the History of the session
Is it possible to get the data that granular with Graphs for the session?
When discussing this with the customer today they are finding little value in RemoteDX and are using Citrix ADM instead
perhaps this would help?
https://www.controlup.com/script-library-posts/analyze-hdx-bandwidth/
need it historically as the issues come to them after the fact and the drops are random spikes not continues
the RemoteDX data from a historical sense is not sensitive enough to see these type of issue with telephony systems. Or please corcet me if i am wrong
Wish i could help. I’m dealing with a similar issue with Video quality and not finding stats to help in CU
i think that would be the same unless u are seeing that in real-time the historical data might not help
@member any thoughts on this?
Another idea would be to configure a trigger that works off the real time data and do some kind of data export at that time. Although the scenario is different, I’ve used that approach with other issues. But it will require some data processing from the raw data
There are always options that we can do with scripting against the data in Realtime but when the issue is only for 2 – 3 seconds and the user complains a few days later in meetings or says this has been happening for the past week that’s when the historical data is key. The Customer identified that they can get the data they need from Citrix ADM so revert to that for troubleshooting all remote user issues instead of RemoteDX but has said if the data was as granular in Controlup as ADM they they would prefer using controlup as all the other data is there as well that they need and not using two different tools. @member @member I said to them I would have the conversation with you guys to see if this can be a request that can go on to the road map (no promises made lol). I’ll add this to shared feedback today
What is the native adm polling interval? Is it less than 3 seconds?
Or reporting interval
If the data granularity is 1 minute with ADM, we should easily be able to capture it with our realtime data, at least from the agent data latency (netscaler integration would be longer because of how often we poll the netscaler API)
Also what was the root cause? Was the latency itself the root cause and did they fix it?
I’m just running through the scenario and what I hear is:
Before:
• User has bad experience
• (Few days later) user complains
• IT: oh we didn’t know
After:
• User has bad experience
• IT: we know :man-shrugging::skin-tone-2:
With alerts on real time data we can achieve the "after scenario".
The interval here is five mins

it’s in this area i am looking at having the interval to Match ADM down to 1 min
yes we could do alerts and some Automated action to gather data but has an enhancement and to reduce the need for the customer to use a rival product This would help
I doubt that we would go to 1 minute intervals on historical data, but my question is more what they’re trying to achieve. If they just want "historical proof" of what happened, we might not be able to deliver on that requirement due to our historical granularity being 5 minutes at a minimum. But if their goal is to proactively reach out to a user that is having issues, you’ll need to have realtime alerting of when it occurs, for which historical data is not the answer, no matter if its our historical data or adm.
For a lot of data we do capture min, max and average over that 5 min interval though. Even historically.
I don’t know if that’s the case for remoteDX data. And even if it is. I’m not sure if we can make it readily available to you.
Hence why Joel tagged David.
Having said that. Even insights captures maximum latency for each interval.
They are trying to troubleshoot an issue with the calls dropping on the telephony system but also understand how much it is happening a produce reports. If I set an alert to let me know for 800 users when latency has a spike above say 300 ms latency or a script to gather data it’s a lot of information the customer would have to go through to and customers don’t have the time for that. It’s why they get controlup of the historical data to rend against. Also when they have found another tool that can provide that granular level they will turn to that tool. But also in my experience averaging latency of 5 minutes will not give the full picture of a user session it’s not sensitive enough but that is just my thoughts 🙂 and why I opened it for discussion here to get controlups input and hopefully to get some feedback from the community to see if my thoughts are off the mark. Lots more smarter and geekier people than me when it comes to these finer details
I think what Dennis is saying is that there are 3 different values, not just average
I’ll have a look here in a minute. Dog needed to get out
lol let dog out before things get messy 😉
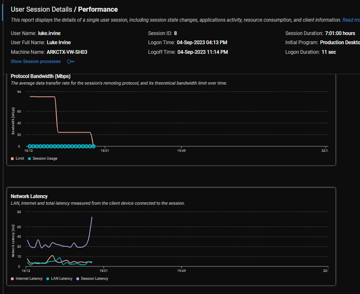
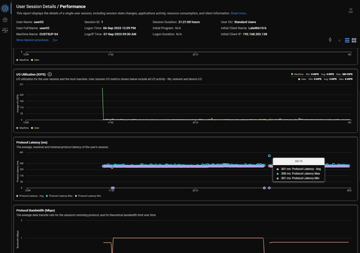
Dennis can correct me if I’m wrong, but in the User Sessions detail there is a Protocol Latency graph. That one will show Avg, Max and Min. Although still 5 minutes, the max will show you the max average within that 5 minute range, and not the average over the 5 minutes.

correct and there should be a max latency column in the session activity grid as well
(or max average)
Hi @member, thanks for the great feedback. Indeed, with the Remote DX historical metrics, we are only showing the 5 min avg, but we should show Min / Max and Avg. so the Max value will show the single 3 seconds sample with the highest number
As @member and @member mentioned above, for the Protocol Latency metric, we already plot the Min, Max and Avg. for each 5-min data point, so you actually have the single 3 seconds sample with the highest latency
Can you please let us know if the 5-min Max value is helpful in this situation?
@member I as far as I know that didn’t show the spikes the customer was seeing, The engineer I was working with on this is off (gone to the Rugby World Cup) ADM I don’t have access to the ADM console to compare.
let me see if I can gather some data but it might need to wait until the week after next
Continue reading and comment on the thread ‘Troubleshooting a Telephony Issue With ControlUp Data’. Not a member? Join Here!
Categories: All Archives, ControlUp Real-Time DX, ControlUp Scripts & Triggers
