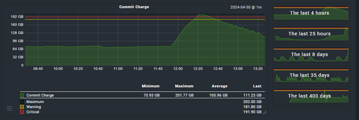
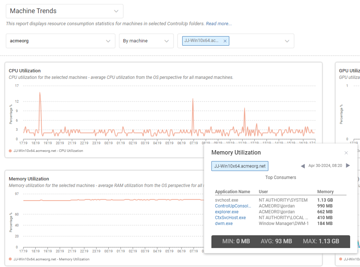
A user asked for assistance with a Citrix server that experienced memory usage spikes, causing the pagefile to fill and lock user profiles. They wanted to know how to identify the cause using ControlUp. It was suggested that they use the Reporting feature to see the top 5 processes using memory at the time of the incident. However, this did not provide the desired information as it could be multiple processes using small amounts of memory rather than one process using a large amount.
Read the entire ‘Troubleshooting Memory Usage with ControlUp’ thread below:
Usage question:
I have a Citrix server 2019 with seamless apps, multiple users about 20 users logged in at the time of the incident, that memory spun out and caused the pagefile to fill the C: drive and locked user profiles on the server.
I want to know what triggered the memory usage.
Is there a way to find this out using ControlUp after the fact?

Reporting > machine trends > by machine
Click on the memory utilization data point that represents a peak and it’ll show you the top 5 at the time

This is interesting, but it doesn’t show what I need it to in this specific case it seems. I don’t see any process running away with memory usage.
Yeah it could be that it isn’t a single process that goes from 100mb to 5gb of memory. Maybe it is 20 processes that go from 200 to 450mb.
Continue reading and comment on the thread ‘Troubleshooting Memory Usage with ControlUp’. Not a member? Join Here!
Categories: All Archives, ControlUp DEX Platform
