• Skip to primary navigation
  • Skip to main content
  • Skip to primary sidebar
  • Skip to footer
ControlUp Community

ControlUp Community

Connect, Learn, and Grow

  • Blog
  • Podcast
  • Meetups
  • Archives
  • Categories
    • ControlUp One Platform
    • ControlUp for Apps
    • ControlUp for Compliance
    • ControlUp for Desktops
    • ControlUp Scripts & Triggers
    • ControlUp Synthetic Monitoring
    • ControlUp for VDI
  • Topics
  • Events
    • Logos & Wallpaper
    • ControlUp.com
  • Join

Understanding DEX User Session Details – Explaining CPU Utilization Percentage Breakdowns

Posted on June 20, 2024

A discussion about the DEX User Session Details reports showing 2 lines on the CPU graph – 1 for computer % utilization and 1 for user %. The user was asking for clarification on what these percentages mean. Another user explained that the user % represents the portion of the CPU utilized by apps launched by the user and their desktop, while the computer % also accounts for the resources needed to keep the OS running. The discussion also touched on how these percentages are broken down on a VM with multiple CPUs assigned and the use of "host machine" in the description. It was mentioned that the computer % will also factor in the usage of other users and system processes on multi-user systems.


Read the entire ‘Understanding DEX User Session Details – Explaining CPU Utilization Percentage Breakdowns’ thread below:

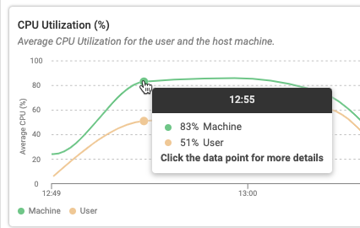
When your looking at DEX User Session Details reports. It shows 2 lines on the CPU graph, 1 for computer % utilization, and 1 for user %. What exactly does this mean? Does it mean the percentage shown for user, equals that percentage of what the computer percentage shows?

In my example, OF the 83% of computer CPU% utilized, 51% of that was user percentage? How would that be broken down exactly for a user? I mean, the app is asking for the CPU, which runs on the machine….


I thought the user % is the portion of the cpu utilized by apps the user launched and their desktop and not all the cpu dedicated to keeping the OS running.


If you look at a VDI or sever with no users logged on you will see the OS will be using X% of the CPU for funning functionality that is system resource user logs the system will again consume more system resources to keep the lights on so to speak. but separate to that the user and applications will also use there own portion of CPU. Similar to how memory will have Private Bites and working Set.


Ok. Let’s keep this going. If the VM has 2 CPU assigned, how is the 83% computer and 51% broken down. Is their percentages broken down over both logical CPU assigned to the VM? And I also noticed the description says "host machine". Is that the VM or the hypervisor host it’s running on?


you can also have multi user systems where computer % shows the user you are looking at + other users + system processes

so essentially 2 counters: one for the computer itself and the other for the user you are looking at

Continue reading and comment on the thread ‘Understanding DEX User Session Details – Explaining CPU Utilization Percentage Breakdowns’.  Not a member? Join Here!


Categories: All Archives, ControlUp One Platform
Topics: CPU, Logs, Reporting, VDI

Ask Us Anything, Connect, Learn, and Grow with the ControlUp Community!

Login to the ControlUp Community to ask us anything, stay up-to-date on what’s new and coming soon and meet other like-minded techies like you.

Not already a member? Join Today!

Primary Sidebar

ControlUp Academy

Enroll in ControlUp Academy for expert-led technical training, equipping you with skills to effectively deploy, manage, and grow your ControlUp investment.

Learn here >

Rotating Images

Hidden Gem from our Community on Slack!

ControlUp Betas - What's Coming Next?
NEW ControlUp Features - Stay Up-to-Date!
ControlUp Scripts - Scripting, Zero to Hero
Latest KB Articles - Be the First to Learn
Did you Know - with Sivan Kroitoru
Practical Perspectives Technical Use Case Training

Video Tutorials Library

Visit our technical how-to videos, offering step-by-step tutorials on advanced features, troubleshooting, and best practices.

Watch here >

ControlUp Blog

Check out the ControlUp blog for expert advice and in-depth analysis.

Read here >

ControlUp Script Library

Visit the ControlUp technical script library, which offers a multitude of pre-built scripts and custom actions for your monitoring and troubleshooting requirements.

See here >

ControlUp Support

Visit the ControlUp support home and to delve deeper into ControlUp solutions.

Browse here >

Download ControlUp RealTime DX

Start with ControlUp for real-time end-user environment insights, swift troubleshooting, and unprecedented performance optimization. Download now.

Download here >

Footer


ControlUp Community
Of Techie, By Techie, For Techie!

Terms of Use | Privacy Policy | Security
Dive Deeper, Learn more at ControlUp.com

  • facebook
  • twitter
  • youtube
  • linkedin

© 2023–2025 ControlUp Technologies LTD, All Rights Reserved.

We use cookies to ensure that we give you the best experience on our website. by continuing to use this site you agree to our Cookie policy..